Analytics. Visualization. Insight. Impact.
Projects
-
![]()
Python-Based Reporting & Document Automation
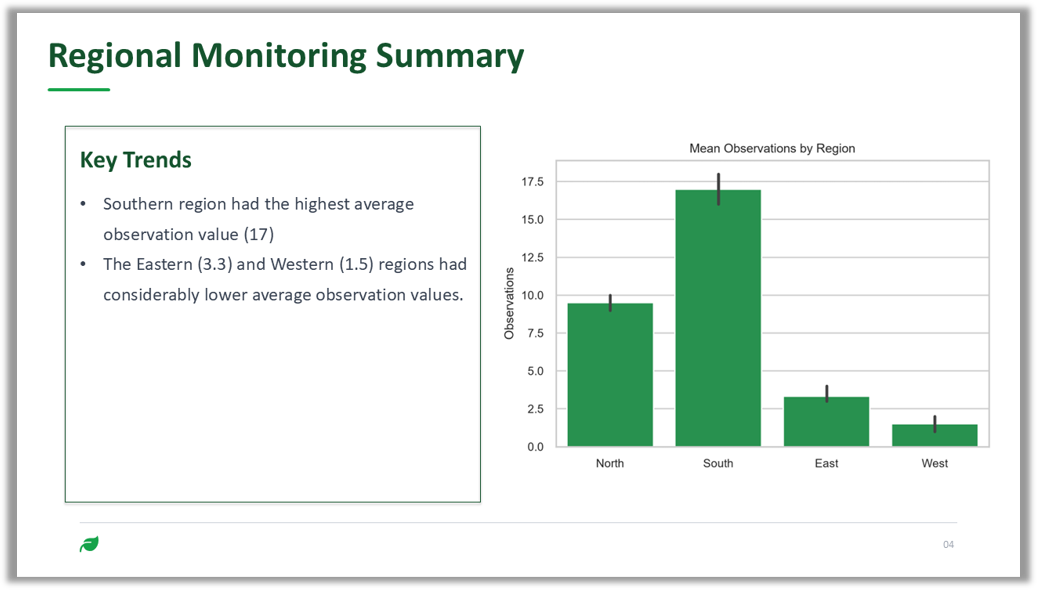
Built reusable Python workflows to transform data and branded templates into polished Word documents, PowerPoint presentations, and image-based email reports.
-
![]()
Large-Scale Environmental Data Processing & Automated Reporting
Built automated pipelines and reporting tools to transform raw datasets into clean, visual reports, helping leadership surface key patterns and improve data reusability.
-
![]()
Analytics Tool for Permitting
Developed a public-facing, data-driven tool to streamline permitting decisions, translating statistical analysis into an accessible interface for regulators and industry.
-
![]()
Real-World Data Infrastructure
Designed end-to-end infrastructure for real-world data collection, analysis, and visualization, enabling data-driven decision-making in regulatory processes.


Connect with me!

